A common method for detecting fraud is to look for outliers in data. It’s a fair approach: even if the detection doesn’t immediately imply fraud it can be a good candidate for further investigation. Still, how might we go about selecting hyper-parameters (or even the algorithm)? The hard part is that we have very little to go on. Just like clustering there’s no label. It is incredibly though to argue if a certain model is appropriate for a use-case.
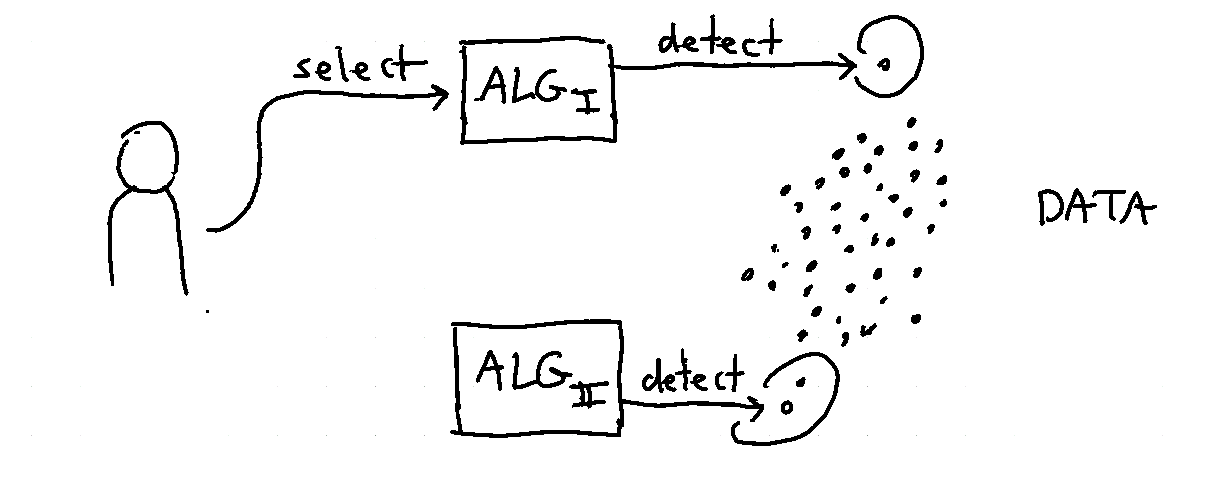
Luckily there’s a small trick that can help. How about we try to find outliers that simply correlate with fraudulent cases? It might be surprise to find out that scikit learn has support for this but it occurs via a slightly unusual pattern.
Setup
I will demonstrate an approach using this dataset from kaggle. It’s an unbalanced dataset meant for a fraud usecase.
import numpy as np
import pandas as pd
import matplotlib.pylab as plt

df = pd.read_csv("creditcard.csv").rename(str.lower, axis=1)
X, y = df.drop(columns=["class", "time", "amount"]), df['class']
With the dataset loaded I’ll run an IsolationForest. Note that I am not labelling, I am merely looking for outliers.
from sklearn.ensemble import IsolationForest
forest = IsolationForest(contamination=0.1, behaviour="new").fit(X)
We can look at the algorithm results but we’re mostly interested in finding a good value for the contamination parameter. One thing you could do manually is to calculate, say, the precision of the predictions.
from sklearn.metrics import precision_score, recall_score
converted = np.where(forest.predict(X) == 1, 0, 1)
precision_score(y, converted)
Note that we’re using np.where here because an outlier detector in scikit learn will output either -1 or +1 while the fraud label will be 0 or 1.
The Problem
We could now go and write a for-loop to consider all the values but this is a lazy hack. It is much more preferable to cross validate the hyperparamter in a gridsearch. You might be wondering how to write a gridsearch that might facilitate this though. After all, we need to manually convert the models output to something the precision score can use and we need to figure out a way to allow our y and X values to also be cross validated. Also, generally, scikit learn has a pattern of using sklearn.metrics.make_scorer that accepts functions of signature score(y_true, y_pred). So how on earth are we going to get this to work?
The main trick is to recognise two things:
- Scikit Learn will also accept a metric function with the signature
score(model, X, y)and if you write a function this way you don’t needmake_scorer. - Scikit Learn models that have a signature of
.fix(X)can also accept.fit(X, y). In this case theyvalue is ignored by the model but can be used for any other part of the pipeline. This includes metrics.
These two facts combined give us a nice pattern:
from sklearn.metrics import precision_score, recall_score
from sklearn.model_selection import GridSearchCV

df_subset = df.sort_values('class', ascending=False)[:80000]
X_subset = df_subset.drop(columns=['amount', 'class', 'time']).values
y_subset = df_subset['class']

def outlier_precision(mod, X, y):
    preds = mod.predict(X)
    return precision_score(y, np.where(preds == 1, 0, 1))

def outlier_recall(mod, X, y):
    preds = mod.predict(X)
    return recall_score(y, np.where(preds == 1, 0, 1))

forest = IsolationForest(contamination=0.1, behaviour="new", max_features=0.2)

mod = GridSearchCV(estimator=forest,
                   cv=5,
                   n_jobs=-1,
                   scoring={"precision": outlier_precision,
                            "recall": outlier_recall},
                   refit="precision",
                   param_grid={'contamination': np.linspace(0.0001, 0.02, 30)})

mod.fit(X, y)
This gridsearch takes a while but afterwards we can visualise the following effect:
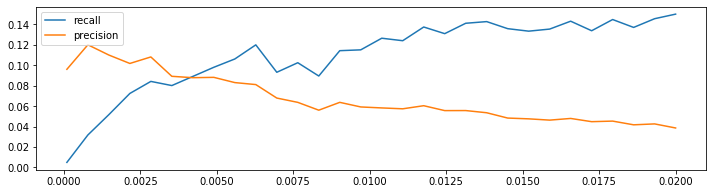
The pattern works! Note that in this dataset there are 492 positive cases out of 284807. It’s pretty interesting to see that we can get near 10% precision/recall with just an outlier detection algorithm considering that the base rate should be near 0.17%.
Discussion
This is a useful pattern but I would warn against using this as a “one size fits all” approach. A better approach detecting outliers is to have multiple detectors that each focus on a different part. The pattern that is explained here is a great way to generate such a candidate but it should not be the only thing that is detecting.
Think about it. Suppose that you are able to come up with 100 valid but alternative methods of detecting if something is “out of the ordinary” then it becomes a lot easier allocate the expensive investigative resources. When suspicion overlaps the odds of finding something that deserves discovery increases.
Think about your case:
Is there unexpected behavior on an account on the short term/long term?
- activity within a session
- the number of sessions increases within a day
- the number of chat messages being sent/received
Is there unexpected behavior on a product on the short/long term?
- the returns of a product suddenly spikes
- the description of a product changes very frequently
- the stock of a product suddenly flucuate immensely
When lots of small systems detect something that deserves attention it becomes a effective proxy to determine on how to spend your investigative resources. If you’re interested in this field of thinking in the fraud space you might be interested in this pydata talk from Eddie Bell.