The goal of this document is to try to explain how you can apply a bit of mathematics to pick an optimal portfolio of pokemon. Why? Pokemon has left a mark on this world and even though I’ve never been the biggest fan, it’s part of my generation. Everybody that I can relate with knows what pokemon is. This makes a pokemon dataset very nice to play and teach with. It is an accessible dataset for a lot of people which makes the math somewhat easier to swallow.
Pokemon theory.
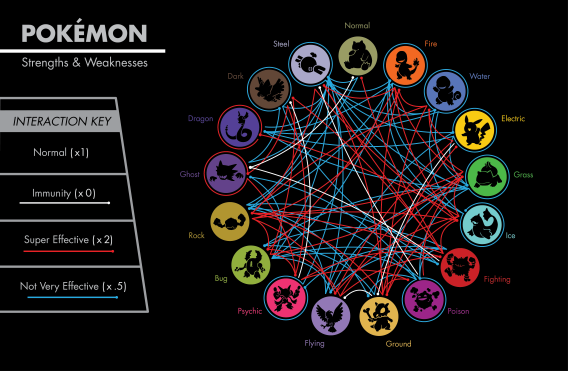
For those not familiar: there exists such thing as a pokemon type There are grass pokemon, fire pokemon, water pokemon, etc. It is a bit like rock/paper/scissors but for genetically engineered superanimals. For example; plant pokemon are weak against fire pokemon, which in turn are weak against water pokmon which in turn are weak against plant pokemon.
To give an impression of how complex the pokemon weakness system can be (source):

A pokemon also has other characteristics that are non specefic to its type. Some are inheretly stronger than others and each pokemon has different properties (some have more health, some have more attack).
The goal of this document is to figure out what an optimal portfolio of pokemon is. After all; a pokemon master can only have 5 pokeballs (prisons for pokemon that you can carry around) and it is unknown which pokemon the opponent has.
Some Math
You can google how damage between pokemon is determined and you can download pokemon information from a reliable api. To compare pokemon I will take the number of turns that a pokemon would be able to stand against an opponent. Because I want to capture that a single pokemon might be able to beat two other pokemon in succession but might be beaten as well this seems like a good metric.
Note that for the remained of this document I assume that each pokemon will only use it’s basic attack and no items will be used during combat. Without these assumption the computation becomes a whole lot harder (maybe even NP-Hard).
This ‘turns that a pokemon lasts’ metric is defined by the following formulae:
\[ T_{ij} = \frac{HP_i}{DMG_{ji}} \]
where \(T_{ij}\) is the number of turns the pokemon \(i\) would be able to survive the opponent \(j\) if it were to be attacked indefinately, \(HP_i\) is the amount of hitpoints that pokemon \(i\) has and \(DMG_ji\) is the amount of damage a basic attack pokemon \(j\) would deal to pokemon \(i\). This damage is defined via:
\[ DMG_{ji} = \frac{2L_j+10}{250} \times \frac{A_j}{D_i} \times w_{ji}\]
where \(L_a\) is the level of pokemon \(a\), \(A_a\) is the attack power of pokemon \(a\), \(D_a\) is the defencive power of pokemon \(a\) and \(w_{ab}\) is the weakness coefficient between pokemon \(a\) and \(b\) which is defined by the types of the pokemon. The data that I used for these weaknesses can be found here.
This is a simplified model where I assume that all pokemon use simple basic attacks continously. Without this assumption the computation becomes a whole lot harder (maybe even NP-Hard).
This is what they look like if you put them in pokedex order.
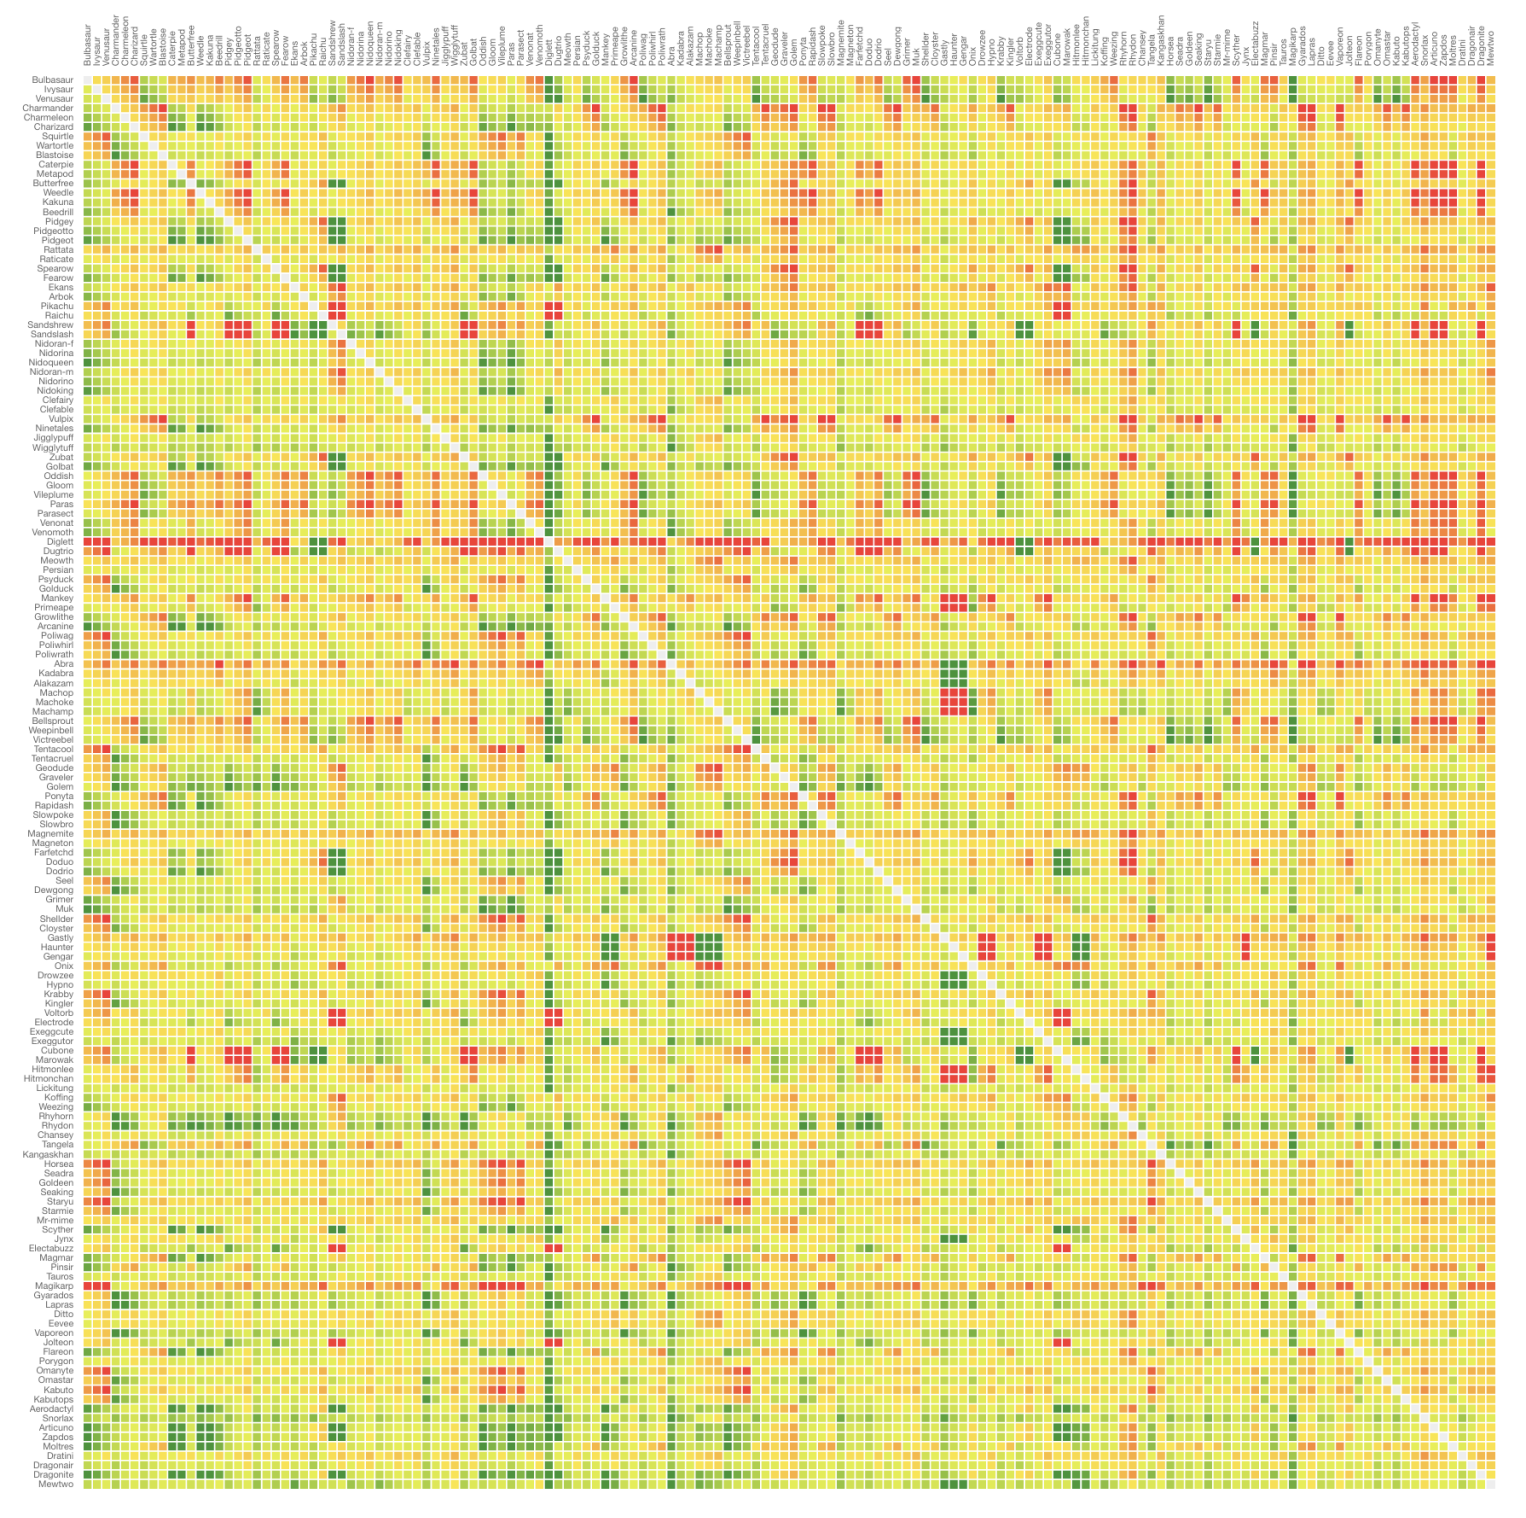
Notice that this graph is assymetric by design. A green cell indicates that the row will win from the column, a yellow colour indicates a draw and a red cell indicates that the row will loose.
Immediately you should be able to see that a few pokemon will rarely win (this corresponds to a horizontal red line). You don’t need the data to know that Diglet, Abra and Magicarp suck, but it is a good confirmation.
Optimal Portfolio
Assuming that when you are walking the plains of Pokemon-land you can’t predict which pokemon will attack you, you need to average the performance of the pokemon over all others to be able say something about how good of a choice a pokemon is. The average performance is not enough though because we’d also want to be able to account for the risk that a pokemon encounters it’s weakness. A pokemon might perform well on average unless it meets its ultimate foe.
In financial mathematics a similar problem occurs with the valuation of a stock portfolio. The stock might perform well on average but it will most likely have a lot of volatility.
For this dataset we calculate two values per pokemon:
\[\mu_i = \frac{\sum_{j=1}^N T_{ij}}{N} \] \[\sigma_i = \sqrt{\frac{\sum_{j=1}^N (T_{ij} - \mu_i)^2}{N - 1}} \]
The top 5 performning pokemon according to \(T_{ij}\) are:
                 mu      sigma
name
Mewtwo     2.827446   5.332813
Lapras     2.947499   6.977950
Dragonite  3.099368  11.387448
Snorlax    3.267974   3.917765
Rhydon     3.341182  12.839635
Notice that the \(\sigma_p\) values vary. If we plot these values of all pokemon with a positive \(\mu_p\) we can see that a disparity exists.
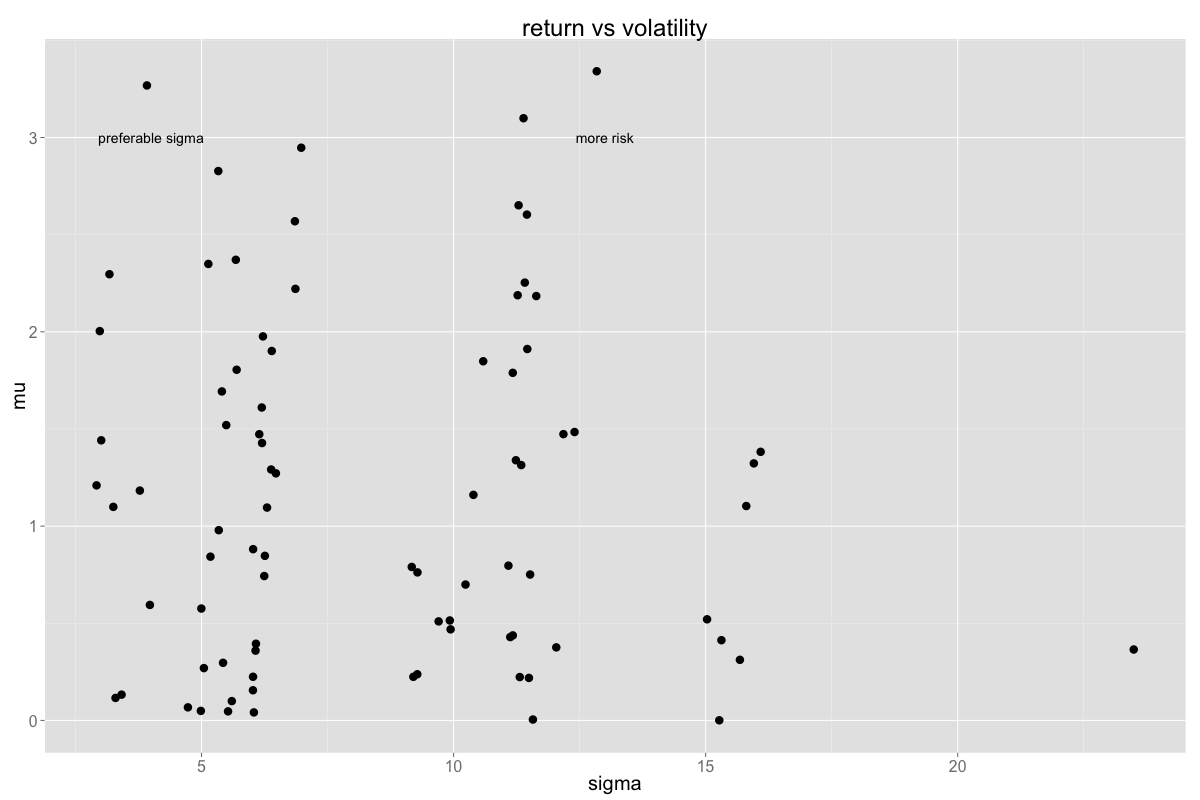
Some pokemon are more efficient in the return/volatility ratio than others. If I now select all pokemon that have a high return but a low volatility I end up with a different top 5:
                 mu    sigma
Wigglytuff 2.296484 3.173598
Snorlax    3.267974 3.917765
Exeggutor  2.349300 5.135687
Mewtwo     2.827446 5.332813
Muk        2.370720 5.680507
Conclusion
So yeah, turns out that you can apply the CAPM model to pokemon.