Scikit-Learn is a package that I have been using for 5+ years and to this day I still discover new components when I read the docs. In particular, I learned about a meta model called MultiOutputClassifier the other day. It’s a class that allows you to copy the pipeline to predict multiple outputs. Besides the classification variant there’s also a MultiOutputRegressor for regression.
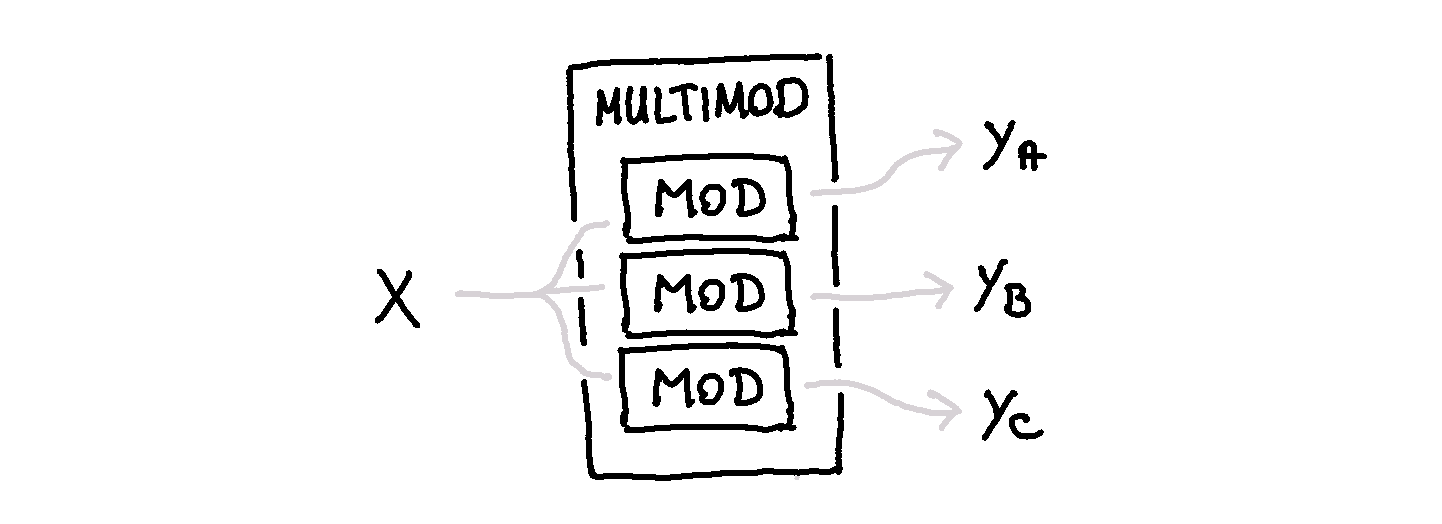
I’m a big fan of meta models. They allow you to add post-processing behavior to a scikit-learn pipeline. The MultiOutput-models will take a model as input and create a copy for multiple labels. That means that you can predict multiple labels from the same dataset \(X\).
This sounds like a useful trick but I had a bit of trouble finding an obvious usecase. I was immediately convinced that it’s a cool tool but I had a bit of trouble finding an example that clearly demonstrates the merit.
Think about it. Usually if you’d like to predict a label you’d want to make a custom pipeline for it. So when would you want to predict multiple labels from a single dataset with the same underlying model? Why would you?
Intervals
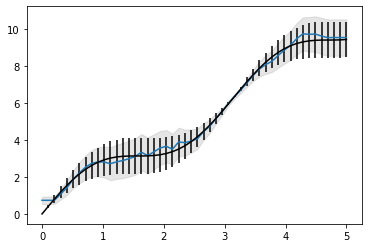
Let’s consider a dataset from a noisy sensor.
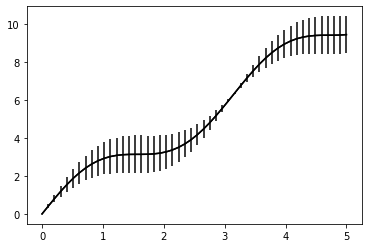
Let’s say we have a dataset \(x, y\) that’s noisy. Depending on the value of \(x\) we have a unreliable value \(y\) that comes with an upper and lower limit. That means that a sample from the distribution above might look like:
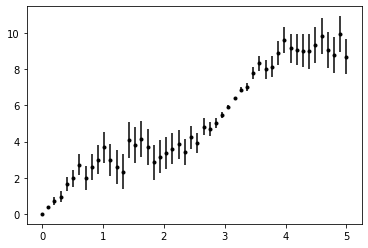
In such a dataset we’d have three labels \(y_{\text{lower}}, y_{\text{middle}}, y_{\text{upper}}\) that we want to predict for every \(x\).
import pandas as pd

df = (pd.DataFrame({'x': xs,
                    'y': ys + np.sin(xs)*(np.random.uniform(0, 2, len(xs))-1)})
        .assign(y_upper=lambda d: d['y'] + abs(np.sin(x)))
        .assign(y_lower=lambda d: d['y'] - abs(np.sin(x))))
And … this might be a use-case for a meta classifier! We’d want a model for each label and for consistency we can argue that we want the same model for all of these labels. It’s a simple implementation too.
from sklearn.multioutput import MultiOutputRegressor
from sklearn.neighbors import KNeighborsRegressor

clf = MultiOutputRegressor(KNeighborsRegressor())
clf.fit(df[['x']], df[['y_lower', 'y', 'y_upper']])
preds = clf.predict(df[['x']])

plt.plot(df['x'], preds[:, 1])
plt.fill_between(df['x'], preds[:, 0], preds[:, 2],
                 color='gray', alpha=0.2)
plt.errorbar(x, y, yerr=np.sin(x), fmt='k');Here’s what we predict with this model.
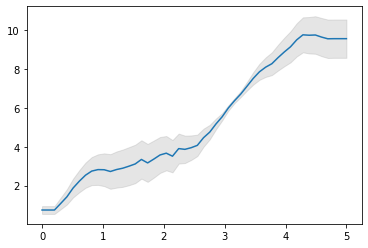
If we overlay the original chart, we can see that it’s a match too!
Conclusion
Granted, this blogpost shows a very simple example. What I like about it though is that scikit-learn always seemed to have a bit of trouble when it comes to dealing with confidence intervals. But if you’ve got a dataset with uncertainty estimates then scikit-learn can learn them easily via the MultiOutputRegressor-meta model.