As a 1st year grad student I had a small nighttime job in a local theatre. For one of my courses I needed to apply my first year knowledge of statistics to some real data. A lot of guys would do regressions on stock markets, others went ahead looking for patterns in olympic medalists but I thought it might be nice to do a small analysis on the ticket sales at the local theatre that I was working for.
My boss was happy to give me some data because he wanted advice. Every year my boss saw an increase in visitors at his theatre and he was wondering if expanding was a good idea. The theatre was willing to supply me with all the data I needed as long as I reported back to them what my findings were with regards to the expansion.
Sweet, after only one year of college I became a data consultant.
The main focus was to predict the amount visitors for the next few years. I knew the amount of visitors per show for every show that the theatre had in the last 10 years. I would use this to do some regression analysis in the hope of being able to get a good trend model.
Being a first year grad student I was especially focussed on getting the numbers right. I made sure that the linear and logistic regression output were correct and I triple checked if the outcome was statistically significant.
Here’s the short story of what I discovered;
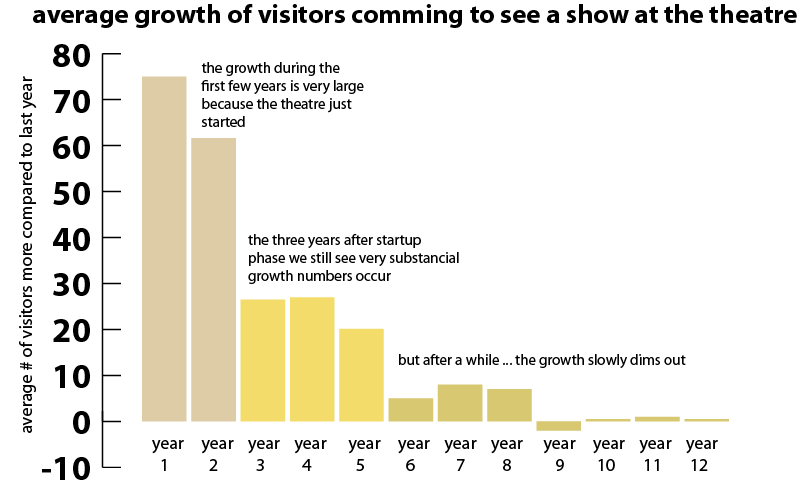
It seemed like a case closed. My boss might have the intuition that the shows were getting more and more visitors but the growth was stagnating. If there are fewer people going to the theatre it would seem like a bad time to invest in a larger theatre. My recommendation was to invest in marketing instead.
I saw the data, analyized it (as thuroughly as you could expect from a first year student at uni) and the outcome was obvious. I even got a very nice fit with some regression functions. All the exams had thought me to be very picky when selecting a model but my model prooved to fit very nicely.
I reported this to my boss, he was happy and impressed. I reported this to my prof and even he was even more happy and even more impressed. He gave me an A+ for the report. He did this largely due to the fact that I found a good way to implement what I have learned in such a relevant fashion.
Vanity
Two days later I was working the bar at the theater and the house was packed. The the week after that, same story and the week after that was no different.
It hit me. The growth that I had been measuring was a vanity metric.
The rise in visitors was declining because the theatre was getting full during each and every show, not because the market of visitors has shrunk. We were measuring the visitors that actually were able to get a seat, not the visitors that wanted to get one!
Now, five years later, it actually turned out to be a good thing the theatre did not expand. The years after this work would turn out to be the years where the Dutch government started massively reducing the subsidies on the cultural sector. If the theatre would’ve expanded it would have had a very rough future trying to earn back it’s invested money.
Still, I learned a lesson here. No matter how good you assume you are with the data be sure to keep your eyes open to all things that the data does not tell you. Do not put blind faith in what numbers seem to tell you until you are quite certain that you know what they don’t.
One More Thing
Please go to your local theatre. There’s real beauty to be seen on stage.