Note
Go to the end to download the full example code.
Interactive Data Dashboard#
This example shows how to create an interactive data dashboard. The static version shows the final result, while the Marimo version allows full interaction.
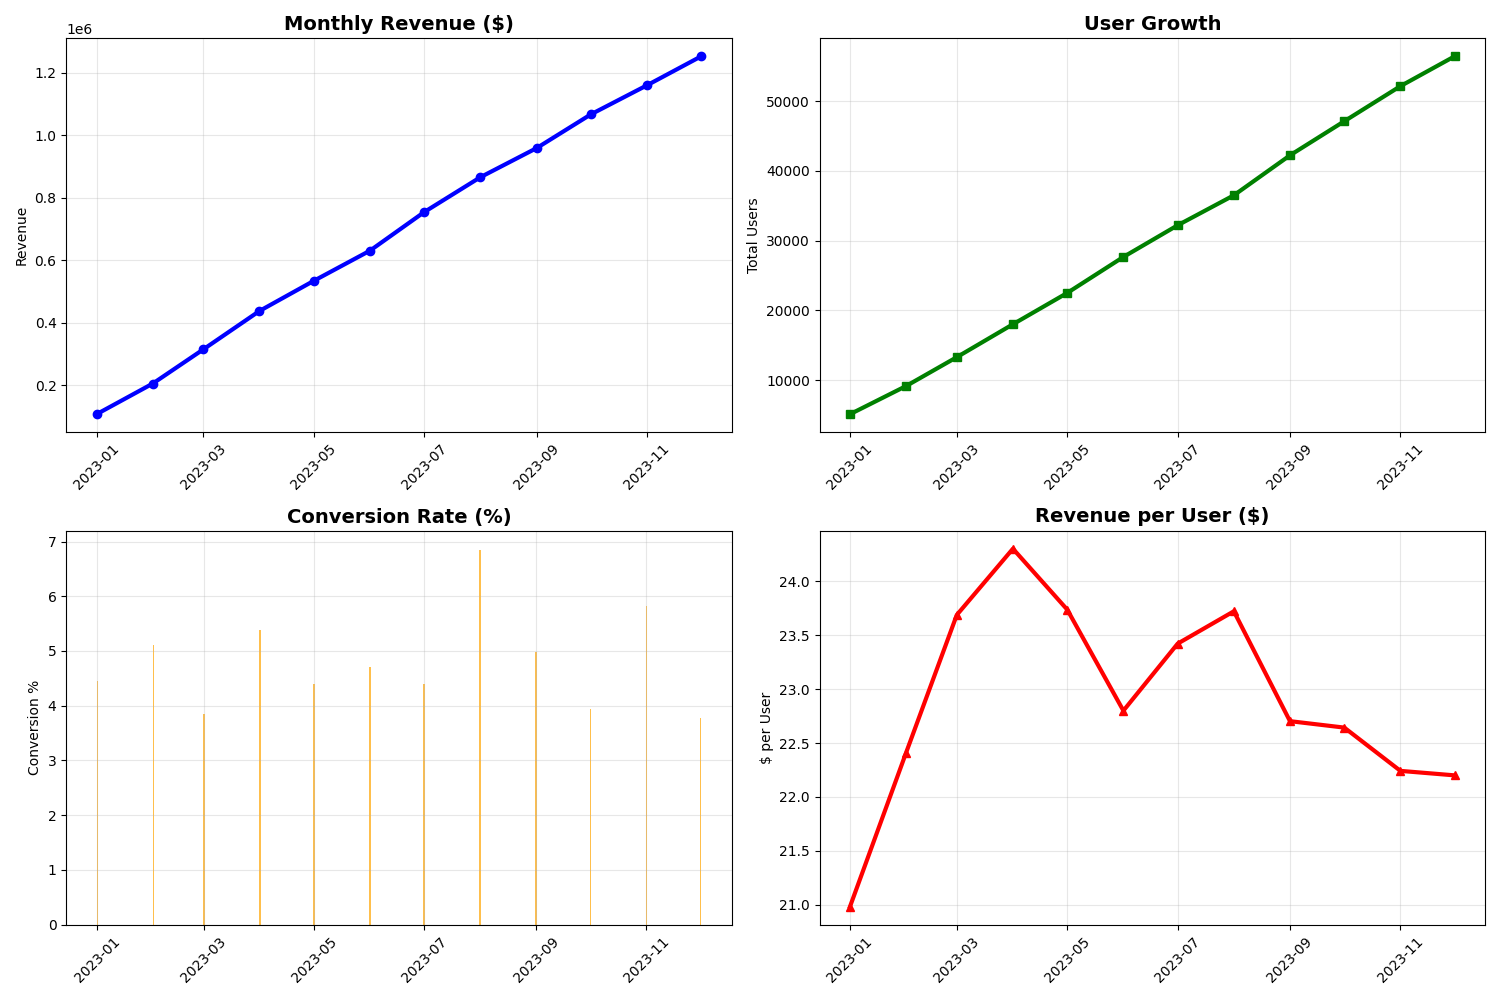
=== Dashboard Summary ===
Total Revenue: $1,253,271.96
Total Users: 56,453
Current Conversion Rate: 3.8%
Revenue per User: $22.20

💡 Launch in Marimo to add interactive filters, date ranges, and real-time updates!
import matplotlib.pyplot as plt
import numpy as np

# Generate sample data
np.random.seed(42)
dates = np.arange('2023-01', '2024-01', dtype='datetime64[M]')
revenue = np.random.normal(100000, 15000, len(dates)).cumsum()
users = np.random.normal(5000, 500, len(dates)).cumsum()
conversion_rate = np.random.normal(0.05, 0.01, len(dates))
conversion_rate = np.clip(conversion_rate, 0.01, 0.1)  # Keep realistic

# Create dashboard layout
fig, ((ax1, ax2), (ax3, ax4)) = plt.subplots(2, 2, figsize=(15, 10))

# Revenue over time
ax1.plot(dates, revenue, 'b-', linewidth=3, marker='o')
ax1.set_title('Monthly Revenue ($)', fontsize=14, fontweight='bold')
ax1.set_ylabel('Revenue')
ax1.grid(True, alpha=0.3)
ax1.tick_params(axis='x', rotation=45)

# User growth
ax2.plot(dates, users, 'g-', linewidth=3, marker='s')
ax2.set_title('User Growth', fontsize=14, fontweight='bold')
ax2.set_ylabel('Total Users')
ax2.grid(True, alpha=0.3)
ax2.tick_params(axis='x', rotation=45)

# Conversion rate
ax3.bar(dates, conversion_rate * 100, color='orange', alpha=0.7)
ax3.set_title('Conversion Rate (%)', fontsize=14, fontweight='bold')
ax3.set_ylabel('Conversion %')
ax3.grid(True, alpha=0.3)
ax3.tick_params(axis='x', rotation=45)

# Revenue per user
revenue_per_user = revenue / users
ax4.plot(dates, revenue_per_user, 'r-', linewidth=3, marker='^')
ax4.set_title('Revenue per User ($)', fontsize=14, fontweight='bold')
ax4.set_ylabel('$ per User')
ax4.grid(True, alpha=0.3)
ax4.tick_params(axis='x', rotation=45)

plt.tight_layout()
plt.show()

# Summary statistics
print("=== Dashboard Summary ===")
print(f"Total Revenue: ${revenue[-1]:,.2f}")
print(f"Total Users: {users[-1]:,.0f}")
print(f"Current Conversion Rate: {conversion_rate[-1]*100:.1f}%")
print(f"Revenue per User: ${revenue_per_user[-1]:.2f}")
print("\n💡 Launch in Marimo to add interactive filters, date ranges, and real-time updates!")
Total running time of the script: (0 minutes 0.135 seconds)