Drawing Features
Sofar we've explored drawing as a tool for models, but it can also be used as a tool to generate features. To explore this, let's load in the penguins dataset again.
from sklego.datasets import load_penguins

df = load_penguins(as_frame=True).dropna()
Drawing
We can draw over this dataset. It's like before but with one crucial differenc
from hulearn.experimental.interactive import InteractiveCharts

# Note that the `labels` arugment here is a list, not a string! This
# tells the tool that we want to be able to add custom groups that are
# not defined by a column in the dataframe.
charts = InteractiveCharts(df, labels=['group_one', 'group_two'])
Let's make a custom drawing.
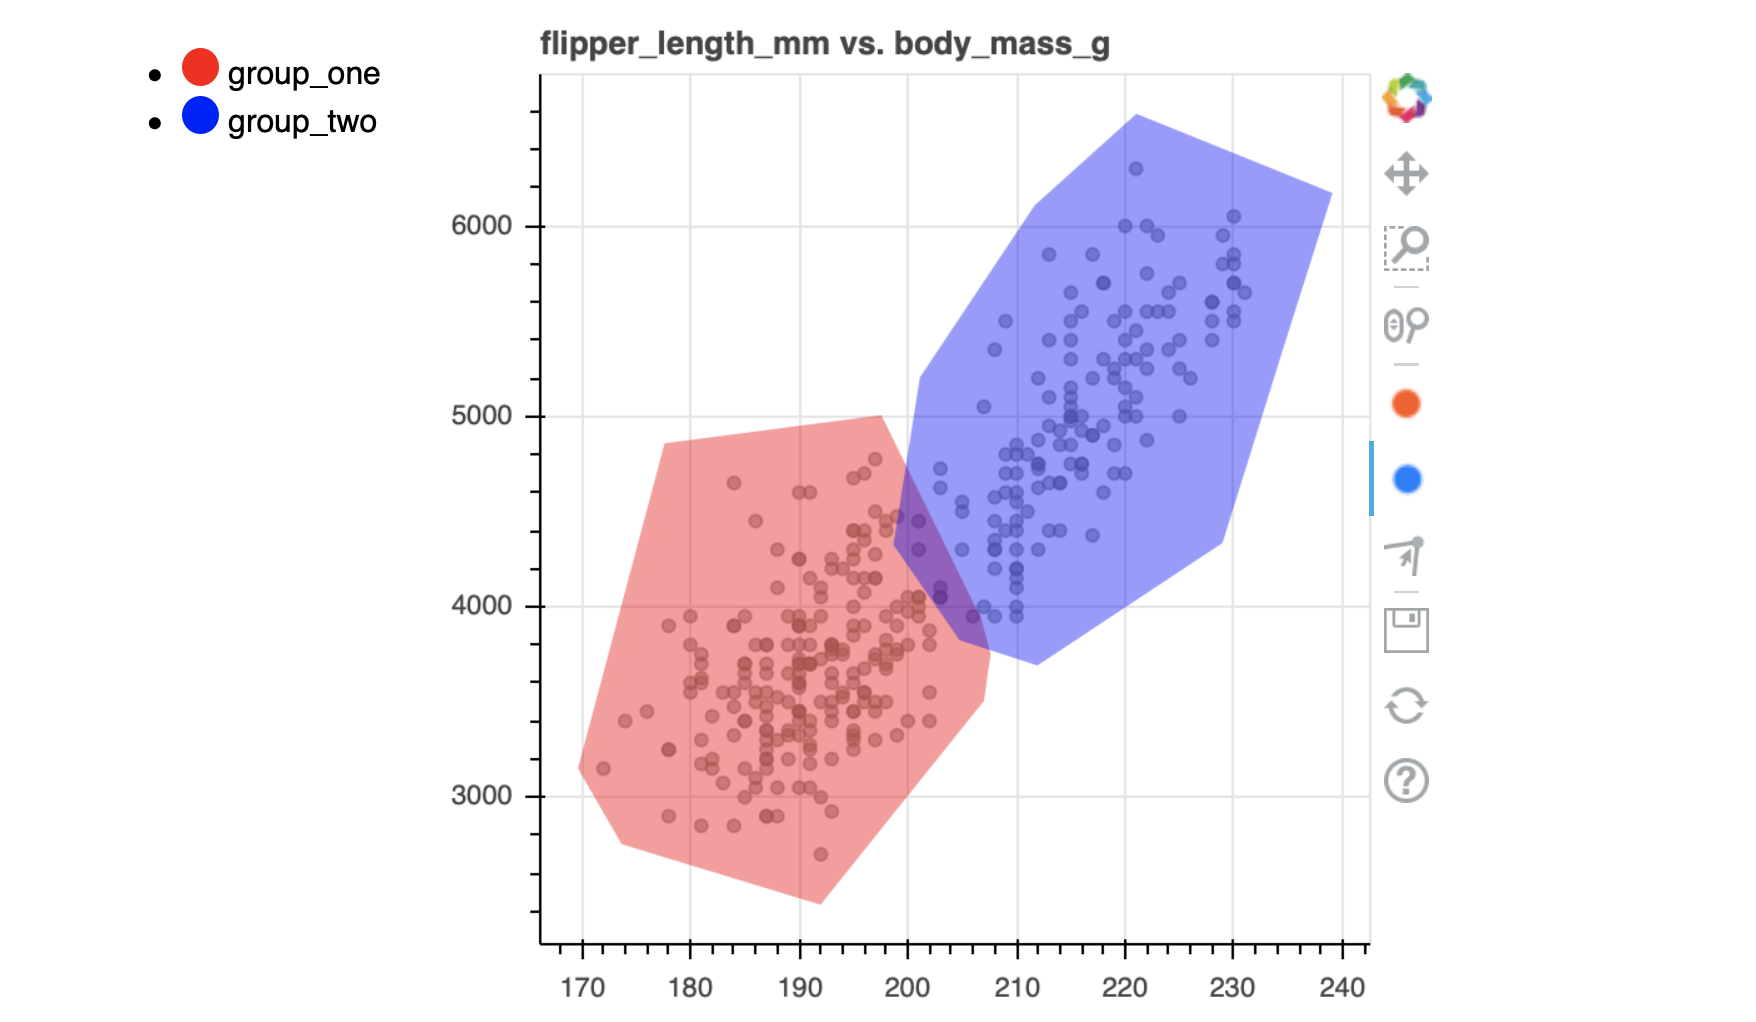
charts.add_chart(x="flipper_length_mm", y="body_mass_g")
Let's assume the new drawing looks something like this.
Sofar these drawn features have been used to construct models. But they can also be used to help label data or generate extra features for machine learning models.
Features
This library makes it easy to add these features to scikit-learn
pipelines or to pandas. To get started, you'll want to import the
InteractivePreprocessor.
from hulearn.preprocessing import InteractivePreprocessor
tfm = InteractivePreprocessor(json_desc=charts.data())
This tfm object is can be used as a preprocessing step inside of
scikit-learn but it can also be used in a pandas pipeline.
# The flow for scikit-learn
tfm.fit(df).transform(df)
# The flow for pandas
df.pipe(tfm.pandas_pipe)